
")
-
GrafStat - Startseite

- English Content
| You start your survey by creating a questionnaire and preparing it as a print- or online-form. Then you run the survey and collect data. After evaluating the data with statistical methods, you can present your results using customised graphics. The Questionnaire Software GrafStat supports you in all the neccesary steps with a clear structure and user interface. |
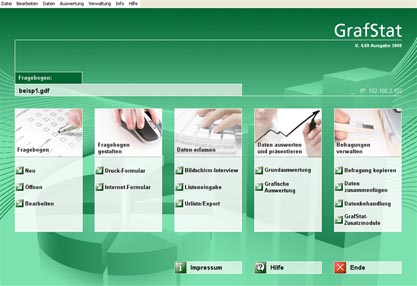 |
From the main window you can access the program functions:
| Create questionnaire | |
| Prepare form for printing | |
| Prepare form for Online-Survey | |
| Enter Data | |
| Scan-Module | |
| Basic list and export | |
| Basic evaluation | |
| Graphical evaluation | |
| Administrate surveys | |
| Example of a HTML-Documentation | |
| Online Examples | |
| What's new | Chronological devolpment of GrafStat since 1999 |
| Program overview |
Overview of the program functions |
| System requirements |
System requirements for your hardware |
| Licensing | The different licenses and what they include |
| Comparison | Differences between the commercial version and the educational version of GrafStat |
| Program features |
All program features in one view |
English translation coming soon!
Some features planned for the next versions
Program function |
Short description |
Animated graphics |
Additional wizard to show evaluation graphics as animated graphics. |
Online surveys on multiple pages |
GrafStat html-forms for online surveys can be prepared as a series of pages, presenting single questions or blocks of questions. |