| The Evaluation
This is a extensive part of GrafStat, where you can evaluate your collected data in diffent ways.
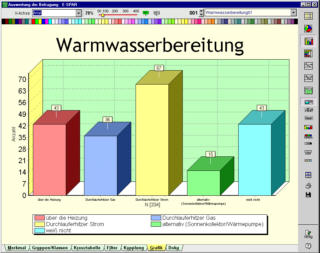
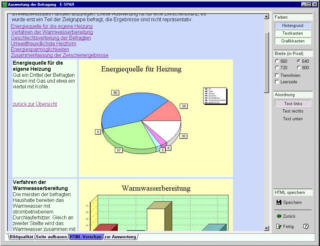
Just pick the desired item (question) and klick the button for the graphic format. After that you can optimise the graphic, add comments and save the completed evaluation. The graphic can be integrated into any text document or used to build a HTML-Documentation.
The data can be concentrated through grouping and filtering. Select a second item and GrafStat generates the corresponding charts. Through couplings you can combine similar items into one graphic.
All the necessary steps are completed within a few clicks and you can focus on the contend of the evaluation.
|
 |


